
When you have set up a connection to your database, regardless of whether this is MS Access, MS SQL Server, a CSV file, an Excel spreadsheet, an XML file or connecting to a database through ODBC, then this screen will allow you to see the database tables and the database records.
Database tables
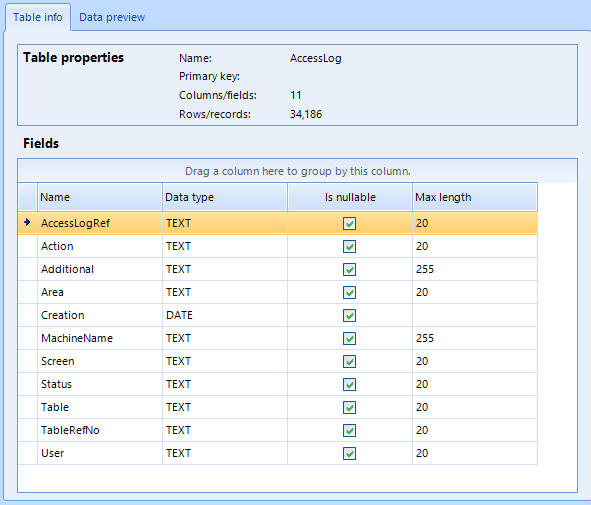
On the left side of the screen is all the database tables from your database. If you have connected to a CSV file, you will only see one table listed. When you click on a table name in the list, then it will display column/field information from the table plus give you a total number of record in the table at the top:
The 'Data preview' tab:
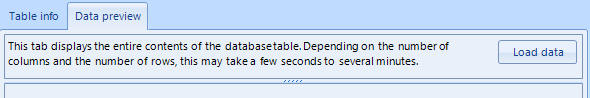
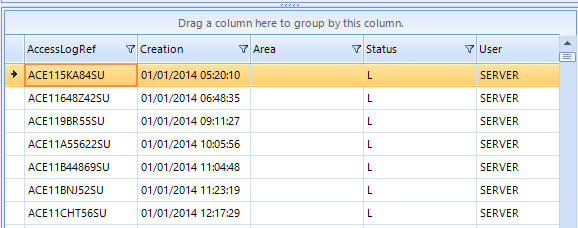
is used to show the table's records/rows. Use 'Load data' button to load the table records into the grid:
Use the Maximizer button at the top of the window to make the Database Viewer full screen to show as much data as possible:

The middle icon above will maximize the screen.
You can click on the column headers to sort the data and even right mouse click them to display a context menu:
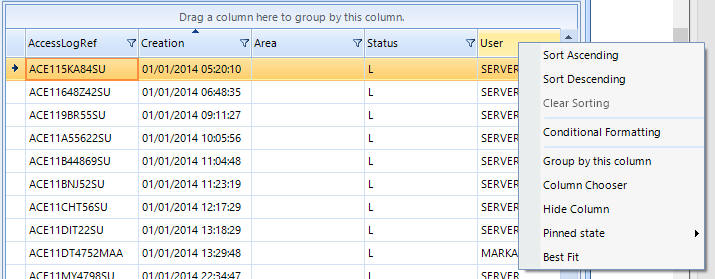
which allows you to sort and filter the information. You can also filter by clicking on the little funnel symbol on the column headers:
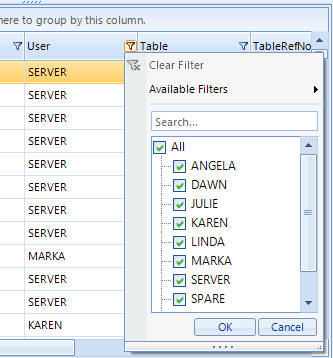
which will also allow you to preview unique values in your data. In the above picture our 'User' column (from one of our databases) has a list of users and you can tick and until you see you the records required. If you do apply a filter or sort the information, then there is also a preview of SQL (Structured Query Language) of the filter you have applied in the grid:
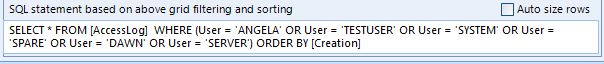
This is for advanced users, such as members of your IT Department and programmers, who may use this to form the basis of custom queries for use when displaying data in Repeat Signage controls.
The 'Auto size rows' button will change the width of columns and the height of individual rows so that you can see the information better.